For many people, the summer months mean longer days and a slower pace, with more time spent on porches and in backyards and connecting with both neighbors and neighborhoods. The communities where we live are important to our overall health and wellbeing. Access to resources and exposures to environmental hazards vary widely throughout the Southeastern Pennsylvania region, and in many cases, the distribution of resources is linked with the socioeconomic status of a neighborhood’s residents. Using data from the most recent Southeastern Pennsylvania Household Health Survey (SEPA HHS), this article examines socioeconomic status and neighborhood level access to one important resource: quality groceries.
The SEPA HHS asked adults age 18 and older to rate the quality of groceries available in their neighborhood. Fewer than 1% reported there was no store in their neighborhood, and other responses varied geographically.
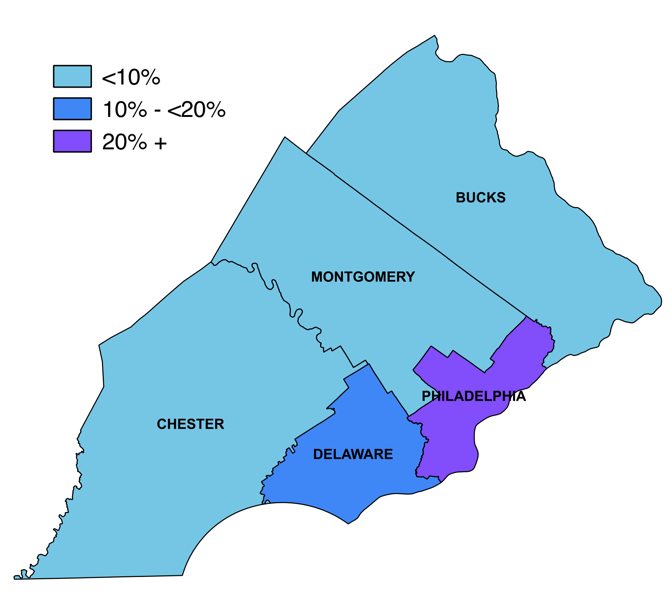
In Bucks, Montgomery, and Chester counties, between 6% and 8% of adults said the quality of groceries in their neighborhoods was “fair” or “poor.” In Delaware County, a slightly higher proportion, 11%, described their neighborhood groceries the same way. However, in Philadelphia the story is different, with 22% of adults in the city describing the groceries available in their neighborhoods as “fair” or “poor.”
Of course, counties are large areas with diverse communities. Zooming in to look at neighborhoods within a county, the differences are clearer. In Philadelphia, though the overall proportion of adults with “fair” or “poor” quality groceries is 22%, within this city of neighborhoods there are great differences. 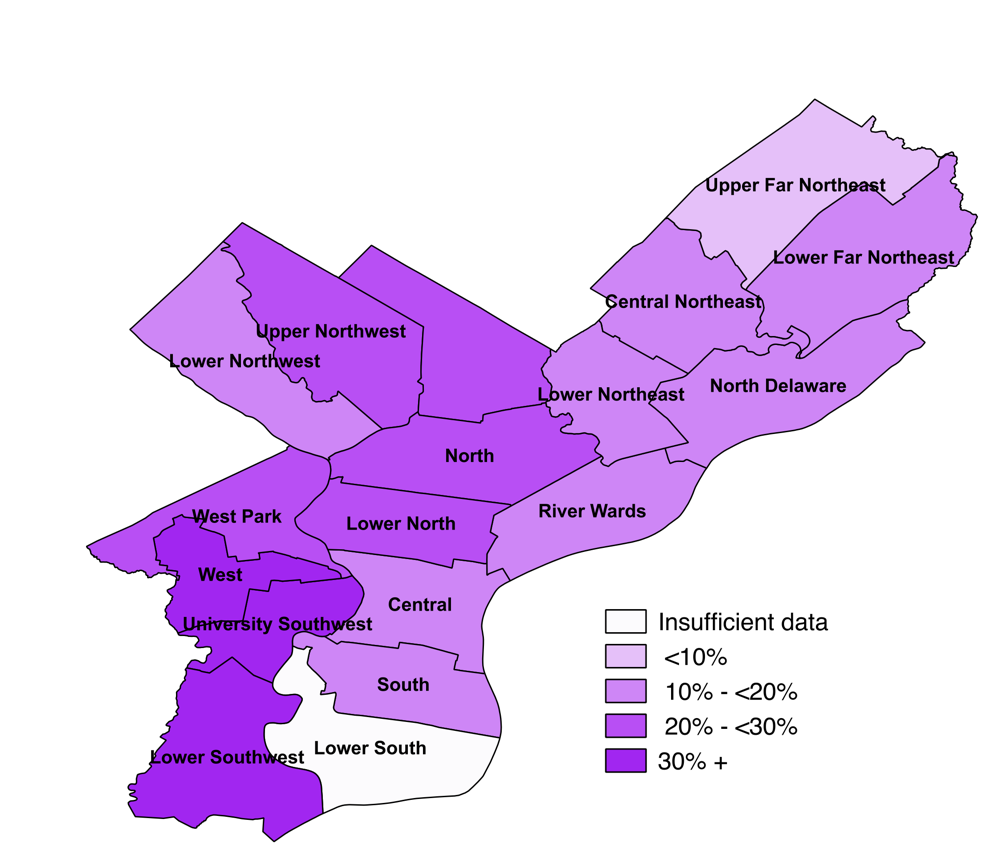
Individual neighborhoods vary widely (this map uses Philadelphia’s Planning Analysis Sections). In the Upper Far Northeast, the proportion with “fair” or “poor” groceries (9%) is comparable to Bucks, Montgomery and Chester Counties. However, in nine neighborhoods more than one in five adults describes their grocery access this way and in three neighborhoods (Lower Southwest, West, and University/Southwest) more than 30% of adults do so.
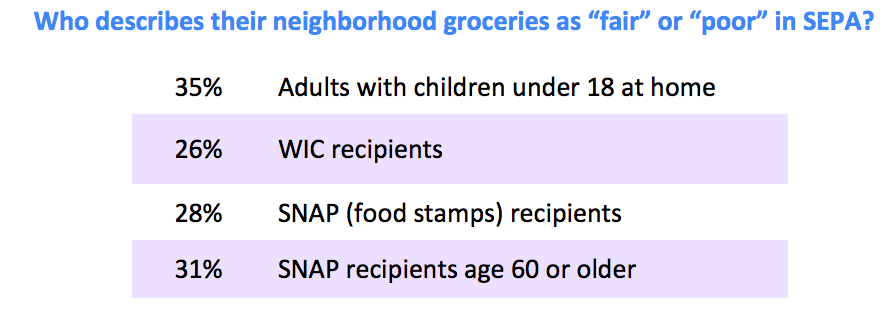
Neighborhoods alone don’t tell the whole story. Across the region, 11% of SEPA adults who live above the Federal Poverty Level have “fair” or “poor” groceries, however a far greater proportion of lower income adults (28%) describe the quality of groceries in their neighborhood the same way. Several other measures show the compounding effects of neighborhood resources and socioeconomic status in our area.
Across Southeastern Pennsylvania’s five counties you’ll find rich farmland, local food producers, national grocery chains and seasonal farm markets. Geographic and sociodemographic factors play a role in which SEPA residents have access to these resources.
If you or someone you know needs help with food resources this summer, The United Way’s 2-1-1 online directory of programs and resources is accessible online or by phone at 2-1-1.
Article written by Rose Malinowski Weingartner, Evaluation Specialist
For more information about this topic or the SEPA HHS, contact Francine Axler at This email address is being protected from spambots. You need JavaScript enabled to view it..